
I asked this question on the Processing journal (image below)
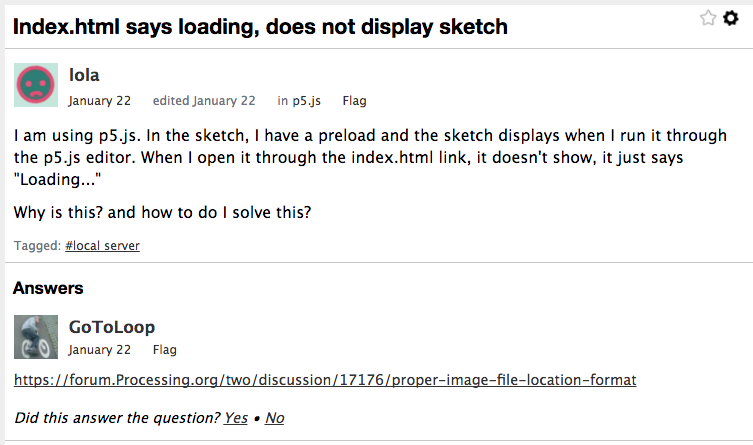
The reply was a link to the same question being answered. (image below)
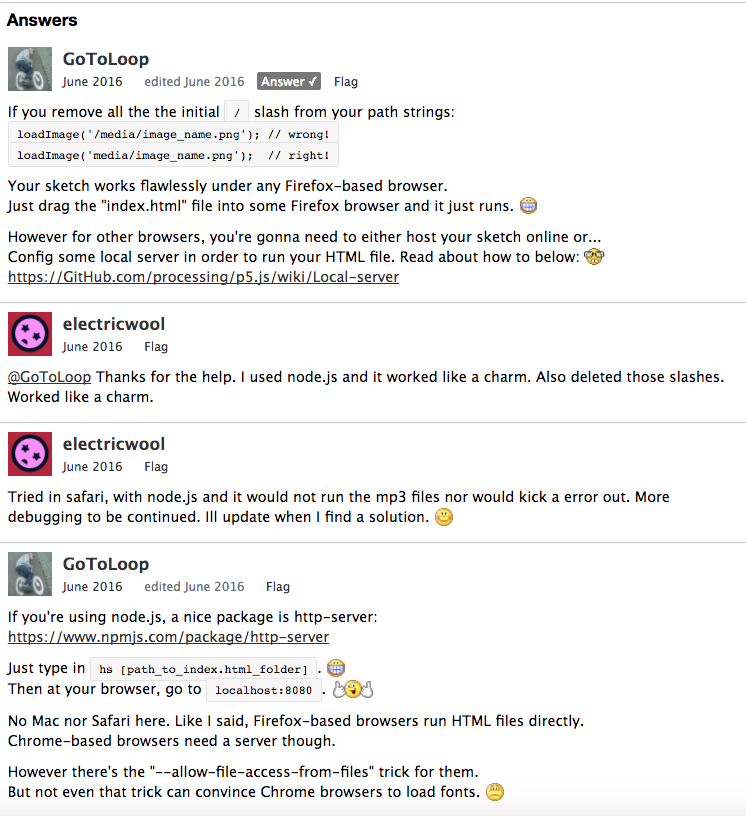
The index.html link in my sketch folder works perfectly in Mozilla Firefox (image below) but not in Safari or Chrome. The solution is to host the sketch online. Which is what I’ve done.

A screenshot of the index.html woking in the Mozilla Firefox browser.
LINK TO FINAL SKETCH
By following a tutorial by Daniel Shiffman, I was able to upload my sketch onto my website using an FTP software called, “CyberDuck”. This link works on both Chrome and Safari, I tested it on the iMacs in the Blue Lab on Monday 23rd Jan 2017.
====================================================================
Link to sketch —– http://acreativejournal.lollypix.co.uk/DMA2004_OYEYEMI_finalsketch/
====================================================================
Artist Statement
Billboard + Twitter is an interactive data visualisation that uses the Billboard’s Twitter Top Tracks Chart to display the Top 5 shared and/or mentioned songs over Twitter from the period when it entered the charts up to 24 December 2016. This data visualisation shows the songs’ entry dates and their positions in the chart over a period of weeks.
Lola took inspiration from many artworks, but the main one was an interactive data visualisation piece made by Matthew Daniels for Polygraph (2016). The artwork inspired Billboard + Twitter because of the layout and the delivery of the data was clear and it had an effective design that put forward the information to the users. Lola achieved the same effect in her project.
By watching a lot of P5.js tutorial videos on YouTube, showing various functionalities of the program, Lola created a project aimed towards music and social media lovers. The interactive visualisation would enable the users to get close to the data on a personal level and see how the song on the chart has changed over a period of time.
The main focus of Billboard + Twitter was the data visualisation and its interactivity. By incorporating mouse actions, such as hovering over the album covers and clicking the bar chart, Lola has made this data visualisation clear and understandable to users.
Billboard + Twitter achieved the requirement of the project brief by displaying past and current states of the Top 5 songs on Billboard’s Twitter Top Tracks Chart and visually demonstrating how it has changed over a period of time.